Story
Recently I bought a refurbished Dell R720 PowerEdge Server on eBay and started setting up my HomeLab. I'm pretty happy with it hosting several VMs for me over PVE.
Right after installing a graphics card(NVIDIA RTX 750 TI from my old PC), I had a feeling that the fans became louder and I decided to setup the monitoring of hardware infomation to have a intuitive view of the running status.
I've already had the ELK up and running so the best that I want would be something to collect data from the hardware and export them to ElasticSearch so I don't have to spin up new infras.
I spent sometime doing some research on Google and found several solutions by using different softwares like Nagios, Zabbix, PRTG etc - not the best for me.
Dell also provides it's own solution called OMSA1. However it's Debian support is only to Debian 8 and it is a lot of effort to install OMSA on lastest PVE which is Debian 10. Even after installation, I couldn't figure out how to send data to my ElasticSearh - I had to give up this direction.
Then I posted on Reddit asking for help and someone mentioned IPMI which became the idea of this post.
Environment
Hardware
- Dell R720
Software
- Proxmox VE, a Debian based virtualization solution running on the server
- ipmitool, IPMI tool which provides OpenIPMI library required by Collectd
- Collectd and it's IPMI plugin, collect IPMI data and send to Logstash
- ELK, your already up and running ELK
Setup
IDRAC
No action needed when running Collectd on PVE which reads IPMI locally from /dev/ipmi0
Enable IPMI
Required.
Steps can be found on this Dell KB
Create a user for accessing IPMI
You can use the root credential to give Collectd access to IPMI, but I recommend creating a new using with limited permissions for security concern.
Steps can be found here
Note: Make sure to give IPMI User Privileges to your newly created user.
PVE
Install ipmitool
root@pve:~# apt install ipmitool # install
root@pve:~# ipmitool sensor # verify
SEL              | na         | discrete   | na    | na        | na        | na        | na        | na        | na
Intrusion        | 0x0        | discrete   | 0x0080| na        | na        | na        | na        | na        | na
Fan1             | 5040.000   | RPM        | ok    | na        | 600.000   | 840.000   | na        | na        | na
Fan2             | 5040.000   | RPM        | ok    | na        | 600.000   | 840.000   | na        | na        | na
...
Install Collectd
root@pve:~# apt install collectd collectd-utils
Collectd config
Change the Server address to point to where is your Logstash server running
LoadPlugin ipmi
LoadPlugin network
<Plugin ipmi>
        <Instance "local">
        #       Sensor "Fan"
                IgnoreSelected true  # enable all sensors
                NotifySensorAdd false
                NotifySensorRemove true
                NotifySensorNotPresent false
                NotifyIPMIConnectionState false
        </Instance>
</Plugin>
<Plugin network>
#       # client setup:
        Server "YOUR-LOGSTASH-SERVER" "25826"
</Plugin>
and restart Collectd and you should be able to see the ipmi metrics from collectdctl.
root@pve:~# systemctrl restart collectd
root@pve:~# collectdctl listval | grep ipmi # verify
hostname/ipmi/current-Current 1 power_supply (10.1)
hostname/ipmi/current-Current 2 power_supply (10.2)
...
Now we have the data collectd from IPMI by Collectd and sending to Logstash.
Next step is to setup Logstash input and output to ElasticSearch
ELK
Logstash
Important
You need to copy the file /usr/share/collectd/types.db from the machine where you installed Collectd to the machine that you are running Logstash and tell Logstash where you put it, otherwise Logstash will fail to decode the metrics types reported by Collectd. See conf below.
wtf@elk:~$ cat /etc/logstash/conf.d/80-collectd-input.conf
input {
  udp {
    port => 25826
    buffer_size => 1452
    type => 'collectd'
    codec => collectd {
      typesdb => ['/usr/share/collectd/types.db']
    }
  }
}
wtf@elk:~$ cat /etc/logstash/conf.d/30-elasticsearch-output.conf
output {
  if [type] == "collectd" {

    elasticsearch {
      hosts => ["localhost:9200"]
      sniffing => true
      manage_template => false
      index => "collectd-%{+YYYY.MM.dd}"
      document_type => "collectd"
    }

  } else {

    elasticsearch {
      hosts => ["localhost:9200"]
      manage_template => false
      index => "%{[@metadata][beat]}-%{[@metadata][version]}-%{+YYYY.MM.dd}"
    }

  }
}
Now your ElasticSearch should be able to receive data like this:
{
  "_index": "collectd-2019.12.27",
  "_type": "collectd",
  "_id": "rLUrR28BzqDHRba3SBmN",
  "_version": 1,
  "_score": null,
  "_source": {
    "collectd_type": "fanspeed",
    "plugin": "ipmi",
    "value": 5400,
    "@version": "1",
    "type": "collectd",
    "type_instance": "Fan4 system_board (7.1)",
    "host": "***",
    "@timestamp": "2019-12-27T11:43:36.345Z"
  },
  "fields": {
    "@timestamp": [
      "2019-12-27T11:43:36.345Z"
    ]
  },
  "highlight": {
    "collectd_type.keyword": [
      "@kibana-highlighted-field@fanspeed@/kibana-highlighted-field@"
    ]
  },
  "sort": [
    1577447016345
  ]
}
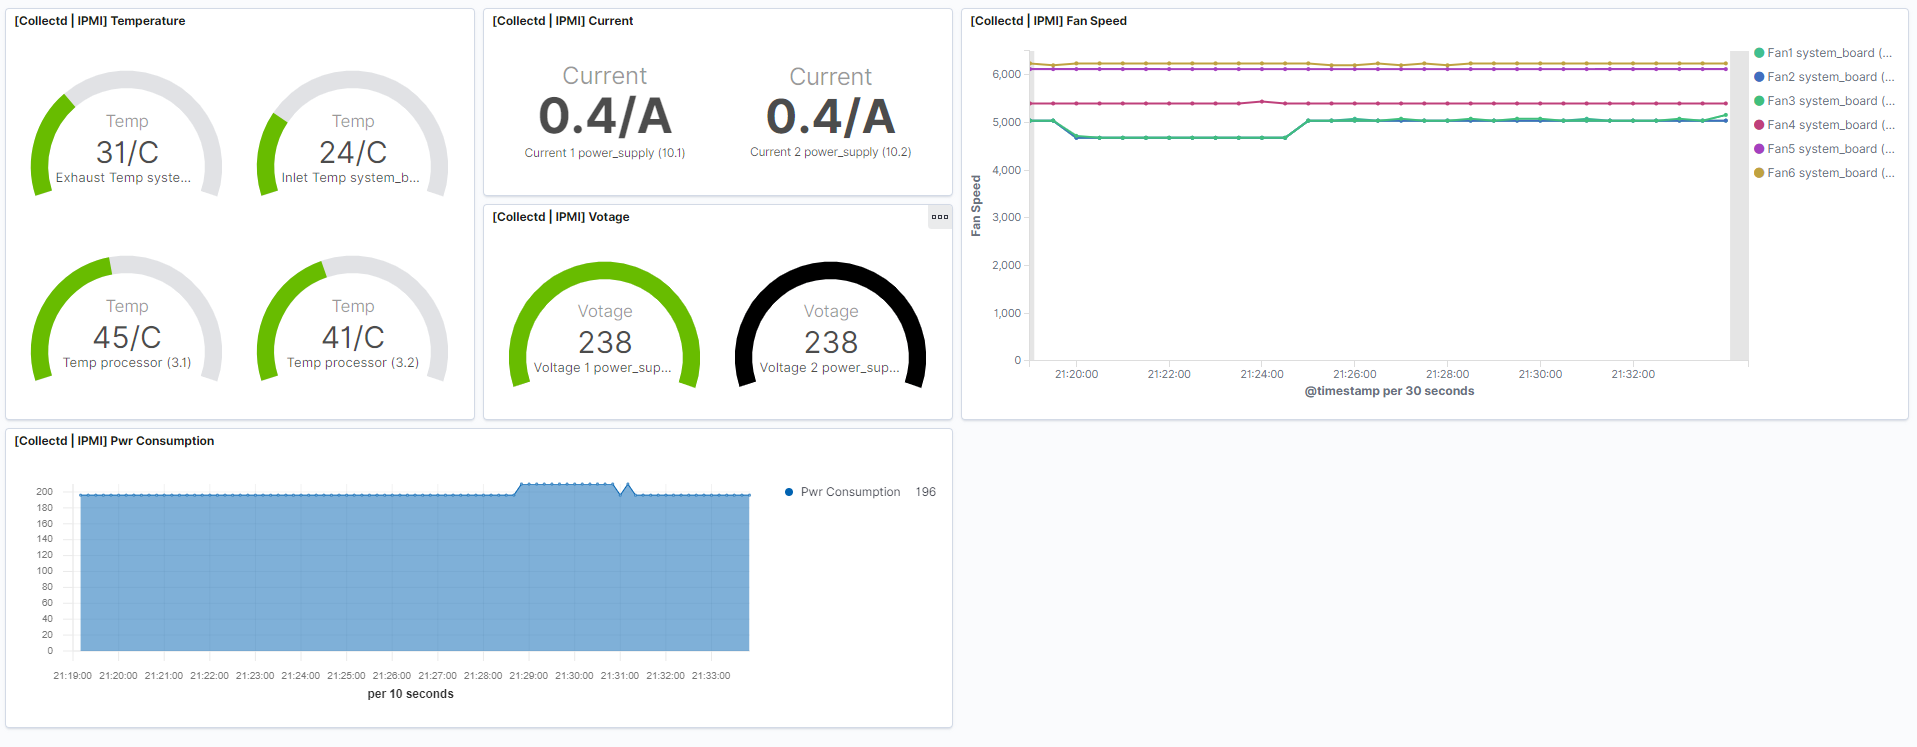
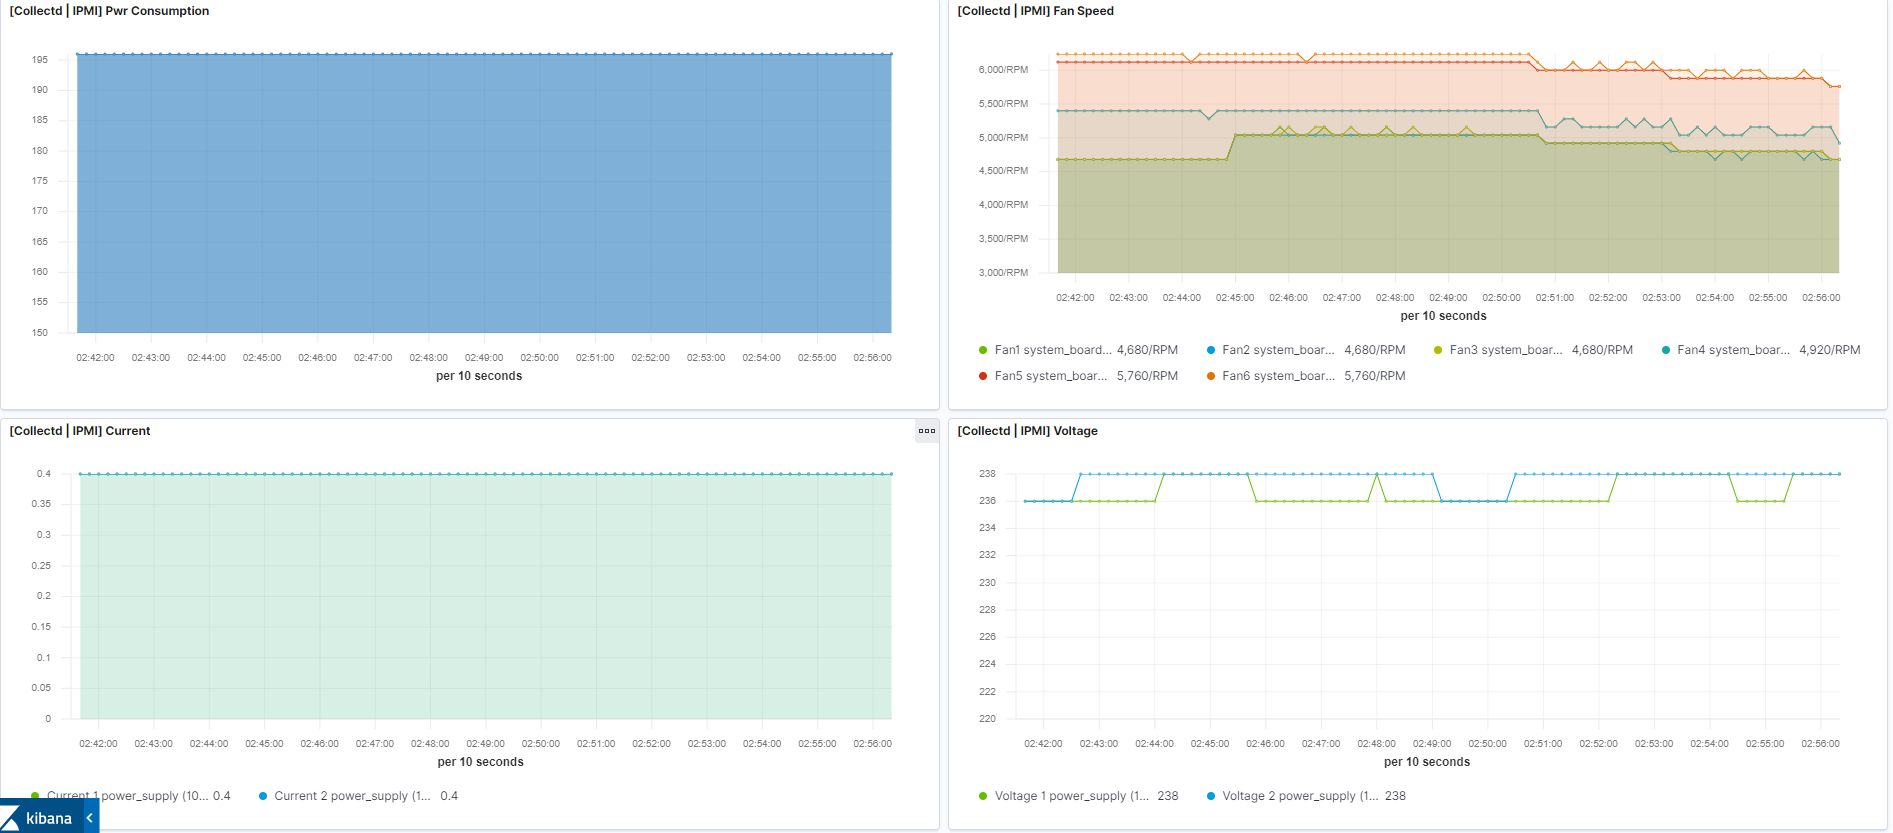
Now you can just setup dashboard on Kibana using the data collected from IPMI!
Result
The R720 IPMI provides these metrics:
- Current
- Voltage
- Fan Speed
- Temperatue
- Power Consumption
And my Kibana Dashboard


Notes
HP iLO also provides support of IPMI2,so in theory, this should also work for HP server